We are publishing here some wonderful charts from Aksel Kibar, CMT Portfolio Manager at Invest AD (the Abu Dhabi Investment Company) with more than 15 years experience. He is a wonderful trader and portfolio manager and has always provided insightful charts. According to his latest charts, the stock markets worldwide are about to enter a full breakout mode and rally if this is for real. Peter Brandt, a famous trader is another one who claims that if these breakouts are for real, we will enter probably the last mode of the bull market and will go up quickly.
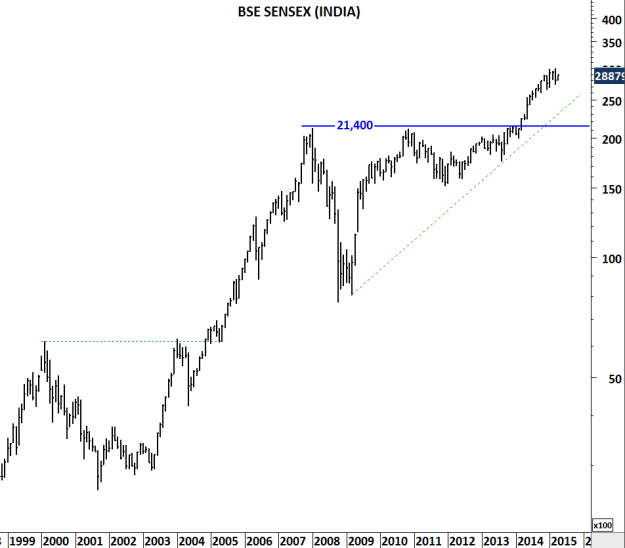
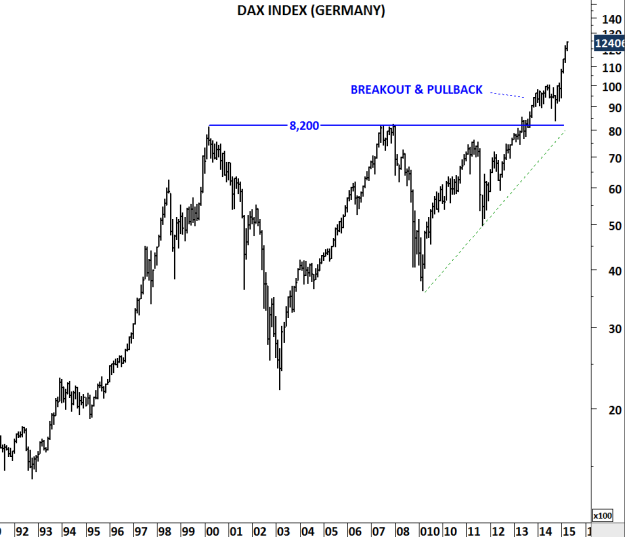
A chart that breaks out to all time high levels has the least resistance. It is called the uncharted territory. Prices are expected to resume their trend after a decisive breakout to all-time high levels. This is what happened with some of the indices over the past few years. I attached below some of the strong breakouts to all-time high levels that have taken place. S&P 500 (INDEXSP:.INX), DAX PERFORMANCE-INDEX (INDEXDB:DAX) and S&P BSE SENSEX (INDEXBOM:SENSEX) index are some of them.

More and more equity indices are now breaking out to all-time high levels or at least preparing for strong breakouts. FTSE 100 (INDEXFTSE:UKX) index is one of them. Index closed the week above strong resistance level at 6,950. Few more weeks of strength will confirm the decade-long breakout. And all this is despite the strong dollar (the USD Index is up 30%+), US equities are performing extremely well.

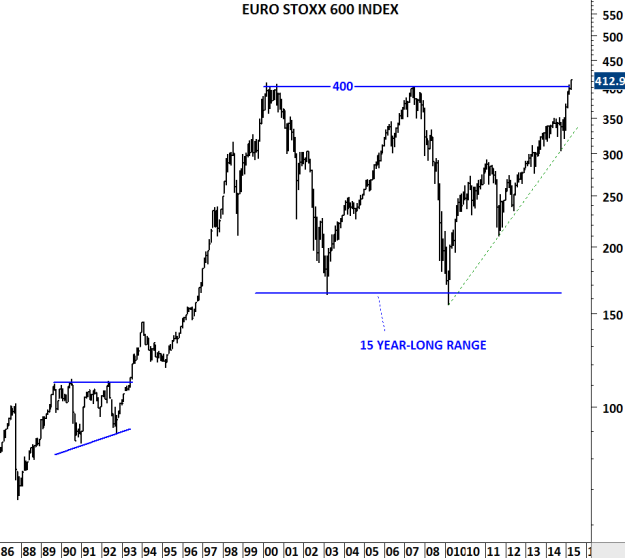
Europe continues to gain strength thanks to ECB. Euro Stoxx 600 index is preparing to clear multi-year resistance at 400 levels. I’m not sure if any of these latest breakouts could end up being bull trap. The best available information (latest price information) suggests strength and increase in upside momentum in global equity indices.
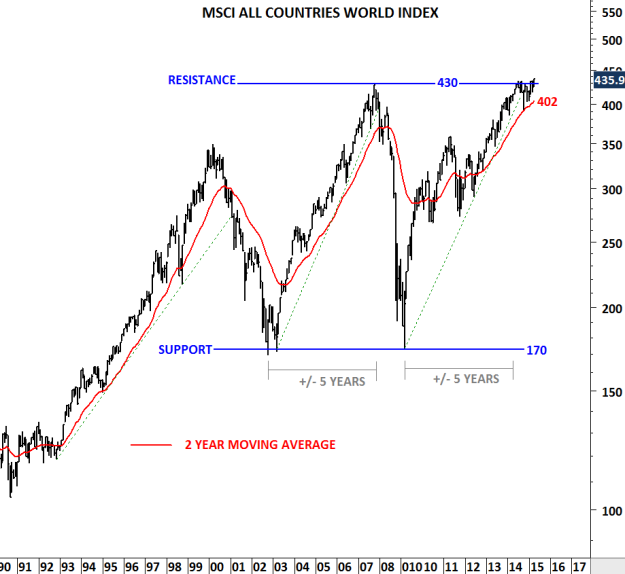
MSCI ALL COUNTRIES WORLD INDEX is now challenging multi-year resistance. Decisive monthly scale close above 430 will confirm the breakout.
About the author: Aksel Kibar is a CMT Portfolio Manager at Invest AD (the Abu Dhabi Investment Company) United Arab Emirates Investment Management. He has more than 15 years experience in the business and is well know for his wonderful charts and trading skills. He runs the blog Tech Charts. Tech Charts is a blog for technical analysis of currencies, commodities, equities and economic indicators. On this blog you’ll find several updates on different asset classes and widely followed economic indicators with different technical approaches. Bollinger bands and indicators will be frequently applied to identify short and intermediate term opportunities. Other tools will include basic trend lines, chart patterns and moving averages.